

One Problem Loan, Seen from the Boardroom
Amerinote Capital Funding purchases residential and commercial mortgage loans from institutions across the United States.
The meeting nobody wants to have
Anyone who has sat through a board or ALCO meeting with a problem loan on the agenda knows that the conversation is rarely about the loan alone. It is about how the bank will look on the next peer report, what the auditor will say about the allowance, how the examiners will read the file and (said quietly, if at all) whether the people in the room will look like they saw it coming. Booking a loss is painful, and booking one after someone asks why you did not see it sooner is worse. This is not an argument for selling. In order to help a board decide, I would rather show what each choice costs, using public Call Report data and the published rules. This brief is written for banks in the weaker tail of their peer group, as well as for healthy banks carrying one or two outlier loans.
I built a composite bank from the June 30, 2026 Call Reports of every insured bank with $500 million to $3 billion in assets (1,379 banks with usable data). The typical bank in that group has $939 million in assets, and I gave it the peer-median value of selected ratios, so its noncurrent loans run 0.45% of total loans and its Tier 1 leverage ratio sits at 10.60% [1]. It is not a real bank, and yours will differ, but it is a fair stand-in for the middle.
What one loan does to the numbers people see
If that $939 million bank puts a single $2 million loan on nonaccrual, its noncurrent ratio goes from 0.45% to 0.74%, which is worse than 65% of its peers. If the loan is $10 million, the ratio goes to 1.91%, worse than 88% of peers and close to the 90th-percentile line of 2.03%. A $1.45 billion bank (the 75th percentile by size) with one $20 million nonaccrual loan lands at 2.35%, worse than 92% of peers [1].
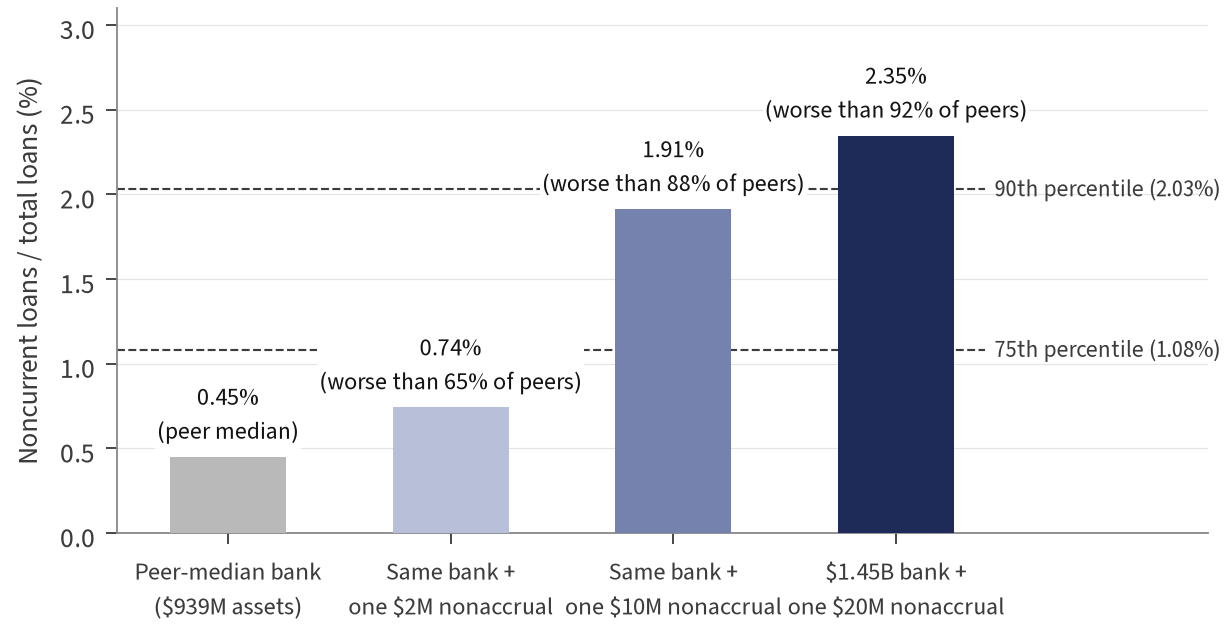
Source: FDIC BankFind Suite, Call Report data, June 30, 2026, insured banks with $500M–$3B in assets (n = 1,379), retrieved Oct. 17, 2026; Amerinote calculation (Oct. 17, 2026). Composite banks use peer-median ratios at median ($939M) and 75th-percentile ($1.45B) asset size; the problem loan is added to noncurrent loans.
The same $10 million loan takes the Texas ratio (problem assets against the loss-absorbing cushion) from 3.1% to 13.1%, worse than 88% of peers, and takes reserve coverage from 263% of noncurrent loans to 72%, below 85% of peers.
Capital tells a different story. Reserving the loan down to the value of its collateral, which the 2023 interagency policy statement ties to “the current condition of the property, not the potential value of the collateral at some future date” [2], costs the bank about $1.3 million before tax and takes Tier 1 leverage from 10.60% to 10.50%. From there, a sale at 70% of the balance moves it to 10.38%, and three years of holding in a slipping market moves it to 10.41%. Capital barely moves either way. The visible ratios move a lot, and they stay up for as long as the loan sits on the books.
| Situation | Noncurrent / loans | Texas ratio | Reserves / noncurrent | Tier 1 leverage | Pre-tax cost |
|---|---|---|---|---|---|
| Before the problem | 0.45% | 3.1% | 263% | 10.60% | — |
| Nonaccrual, reserved to collateral value | 1.91% | 13.1% | 72% | 10.50% | $1,304K |
| Sell now at 85% of balance | 0.46% | 3.1% | 263% | 10.49% | $196K |
| Sell now at 78% of balance | 0.46% | 3.2% | 263% | 10.44% | $896K |
| Sell now at 70% of balance | 0.46% | 3.2% | 263% | 10.38% | $1,696K |
| Hold 3 years, values flat | 1.91% | 13.2% | 72% | 10.45% | $605K |
| Hold 3 years, values −2.5%/year | 1.91% | 13.2% | 77% | 10.41% | $1,257K |
Amerinote calculation (Oct. 17, 2026) from FDIC Call Report data for June 30, 2026.[1] Loan balance = 115% of collateral value. The $1.3 million specific reserve is booked as provision expense and reduces capital, after tax, in every row after “Before the problem.” Pre-tax cost = the reserve in the nonaccrual row, and net book value minus price for a sale, booked once. Counting the reserve already booked, the total pre-tax loss on the loan is $1.5 million at 85%, $2.2 million at 78% and $3.0 million at 70%. Holding cost per year = funding at 1.82% on the $8.7 million net book value ($158,189), servicing at 0.25% of the $10 million balance ($25,000) and staff time ($18,450), or $201,639 a year and $604,917 over three years, not discounted. The slipping case adds $652,174 of further reserves. For simplicity the reserve uses collateral value before selling costs; with a 1% cost to sell, it would be about $1.39 million. Capital effects use a 21% tax rate and assume the tax benefit is fully usable. Taxes are simplified. For banks over $500 million, reserves are not deductible until charge-off or sale (26 U.S.C. § 585(c), § 166), a loss on sale is ordinary (§ 582(c)), and state taxes and S-corporation status differ.[3] The composite’s coverage (263%) differs from the true peer median (232%). Sale prices are illustrations, not market data.
Reserving is often the first step. Once the loss is confirmed, the shortfall is charged off, and the 2023 statement says some or all of it “may represent a loss for classification purposes that should be charged off against the ACL in a timely manner” [2]. Charged off, the same loan shows a 1.73% noncurrent ratio (still worse than 87% of peers), 69% reserve coverage and a 12.0% Texas ratio. Tier 1 capital is the same either way.
What the examiners actually say
Many bankers assume that examiners want problem loans gone. The written guidance does not say that. The 2023 policy statement says that “prudent CRE loan accommodations and workouts are often in the best interest of the financial institution and the borrower.” Banks that work out loans “after performing a comprehensive review of a borrower’s financial condition will not be subject to criticism for engaging in these efforts, even if these arrangements result in modified loans that have weaknesses that result in adverse classification” [2].
So where does the criticism come from? It comes from holding without a plan, and from holding without recognizing losses on time. The statement is written about workouts, not sales, but its conditions describe what examiners look for in any problem-loan strategy. Examiners will not criticize a workout “so long as management has” met a list of conditions, starting with “a well-conceived and prudent workout plan that supports the ultimate collection of principal and interest” and ending with an allowance that “recognizes loan losses in a timely manner through provision expense and recording appropriate charge-offs” [2]. The asset quality rating weighs “the level, distribution, severity, and trend” of problem and nonaccrual assets, as well as “the ability of management to identify, measure, monitor, and control credit risk” [4]. I know of no survey that measures a board’s fear of looking unprepared, but the rating language suggests the answer to it is a documented plan and timely charge-offs, whichever way the bank goes.
Supervision is also shifting. An OCC–FDIC rule finalized Aug. 27, 2026 and effective Nov. 2 for OCC- and FDIC-supervised banks limits matters requiring attention to practices that could materially harm a bank’s financial condition (or to actual violations of law), and it tells examiners to “prioritize concerns related to material financial risks over those regarding policies, process, documentation” [5]. A May 2026 FFIEC proposal, not yet final, would refocus CAMELS ratings the same way [6]. That moves examiner attention away from paperwork and toward what a sitting problem loan does to capital, earnings and asset quality.
Two other rules shape the room. Banks with $1 billion or more in assets (as adjusted, raised from $500 million as of Jan. 1, 2026) at the start of the fiscal year need annual statements “audited by an independent public accountant” that “reflect all material correcting adjustments” the accountant identifies [7], and 45.6% of this group had at least $1 billion at June 30 (a rough proxy for that test). Finally, for banks that report risk-based capital, a nonaccrual exposure generally carries a 150% risk weight against 100% for a typical performing commercial real estate loan (residential mortgages and loans already weighted at 150% are different), so a $10 million problem loan ties up about $0.5 million more capital at a 10% total capital ratio [8]. That does not apply to the 477 peers (35%) using the community bank leverage ratio framework [9].
The pressure is in the tail, not the middle
Across the same asset band, the median noncurrent ratio has risen every year since June 2023, from 0.24% to 0.32%, 0.39% and now 0.45%. Some perspective matters. 2023 was close to a historic low, today’s median is still below June 2019 (0.51%) and June 2007 (0.49%) for banks of this size [1], and the FDIC reported that industry asset quality improved in the second quarter of 2026 [10]. The change is in the tail. The 90th percentile went from 1.12% to 2.03%, above both 2019 (1.64%) and 2007 (1.91%). Median reserve coverage fell from 424% to 232%, though it is still above 2019’s 197%, and the share of these banks holding foreclosed real estate rose from 32% to 41% (it was 68% in 2019) [1]. Today 371 banks (26.9%) carry noncurrent loans at or above 1% of loans, and 317 of the banks with noncurrent loans (24.3%) hold an allowance smaller than those loans. For the banks in that tail, the cushion is thinner than it was in 2023. (The banks in this asset band change from year to year.)
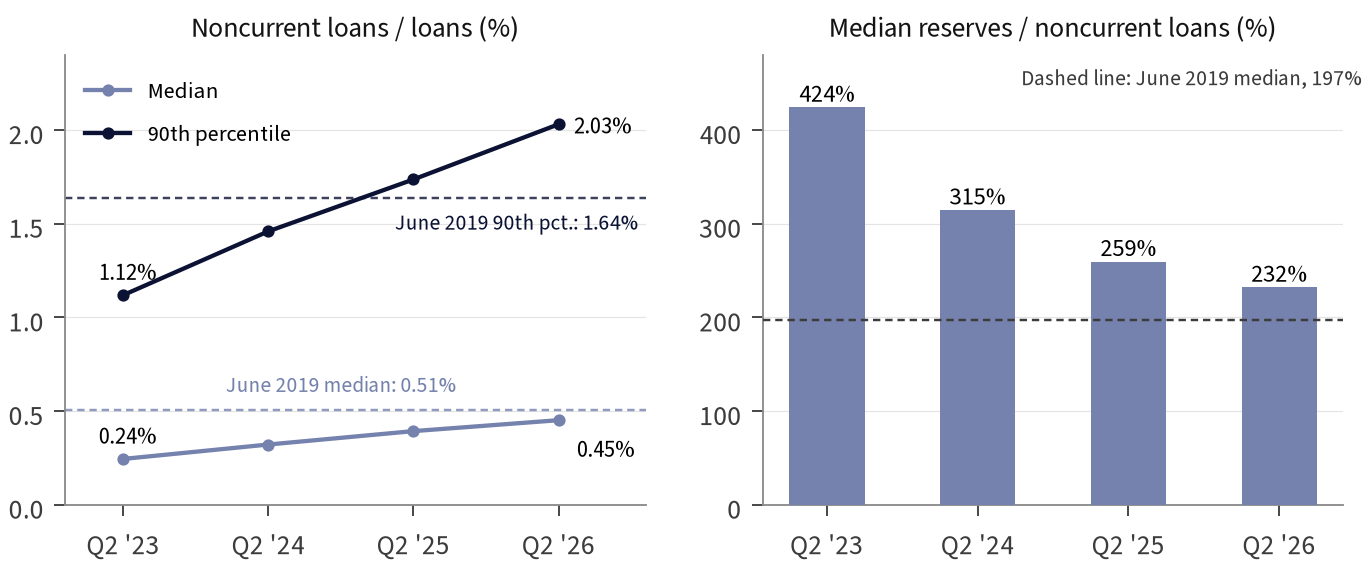
Source: FDIC BankFind Suite, Call Report data for June 30 of each year, insured banks with $500M–$3B in assets (n = 1,364–1,401; 1,139 in 2019), retrieved Oct. 17, 2026; Amerinote calculation of percentiles. June 30, 2019 shown for reference. Reserve coverage excludes banks with no noncurrent loans. See also FDIC Quarterly Banking Profile, Aug. 25, 2026.
Selling versus holding: price, time and trend
This brings us to the real question. What does waiting cost? Holding costs money even when nothing goes wrong. The bank still funds a loan that earns nothing (1.82% a year, the peer median of interest expense to earning assets [1]), pays outside workout costs, proxied by CMBS special-servicing fees of 25 basis points a year on the loan balance and a 1% liquidation fee [11], as well as staff time (0.15 of a full-time employee at $123,000 loaded, from an $86,100 average base salary [12] and a 70.0% wage share of compensation [13]). I ran two collateral paths, flat and down 2.5% of today’s value each year. Neither path is a forecast. Green Street’s index of institutional-quality commercial property rose 4.7% in the year to September 2026 but slipped 0.1% in September [14] and sits about 13% below its 2022 peak, with office still about 33% below [15]. After the Federal Reserve raised its target range to 3.75%–4.00% on Sept. 16, 2026 [16], Green Street warned that “if this rise in yields sticks, property prices are likely to go down” [14]. Community-bank collateral is smaller and less liquid than the property in that index, so your own appraisals matter more than any index.
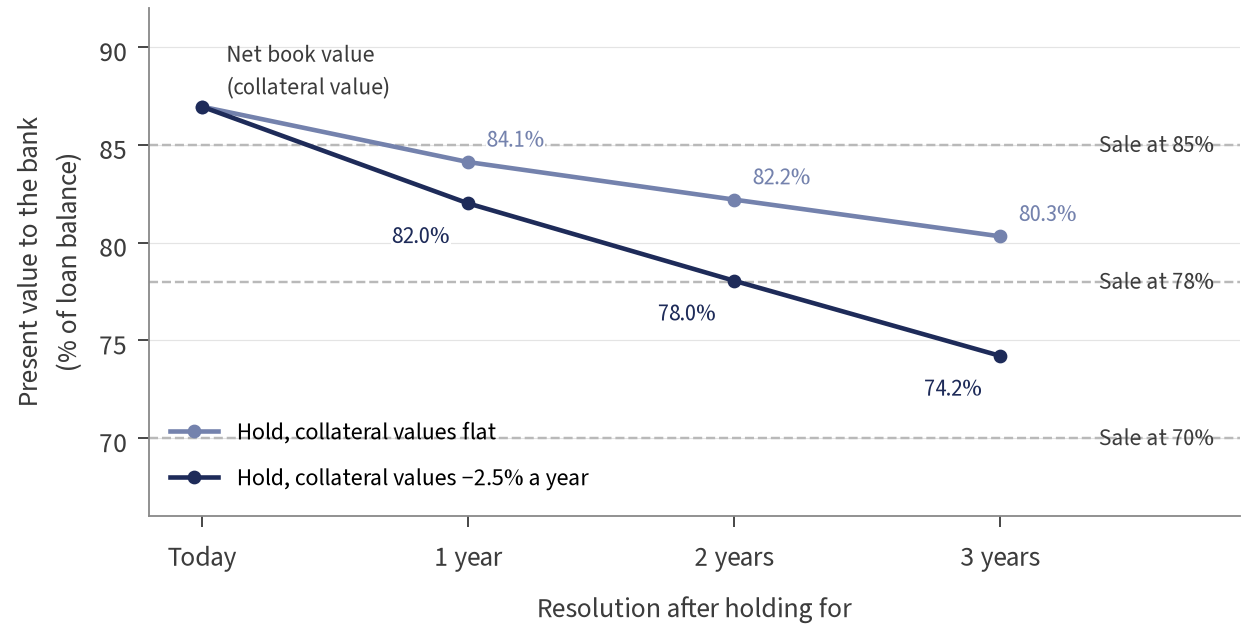
Source: Amerinote calculation (Oct. 17, 2026) using a simple holding model: funding at 1.82% (FDIC peer median interest expense / earning assets, June 30, 2026), workout servicing 25 bp a year on the loan balance and liquidation 1% (Dechert/Wells Fargo, 2013), staff 0.15 FTE at $123,000 (PayScale Feb. 2026; BLS Sept. 2026). Collateral value assumed at 87% of balance (balance = 115% of value); in the declining case it falls by 2.5% of today’s value each year. Assumes no cure. Sale prices are illustrations, not price indications.
Please keep in mind that the 85%, 78% and 70% prices in Figure 3 (equal to roughly 99%, 91% and 81% of the collateral’s current value net of selling costs) are illustrations I chose to bracket the model’s own hold values. They are not market data or a price indication, and I found no authoritative public dataset of 2026 sale prices for $2 million to $20 million nonaccrual loans. Any buyer has to cover its own workout costs and earn a return, so a bid near full collateral value should not be assumed. At the lower end of the range, holding often wins on this arithmetic alone, which is why the ratios, the timeline and the direction of values matter as much as the price. With that caveat, at 85% of the balance a sale beats every hold out to three years. At 78% it roughly ties a two-year hold in a slipping market (78.0%) and beats a three-year hold when values are slipping (74.2%), but not when they are flat (80.3%). At 70% it beats none of the one-to-three-year holds, and only comes out ahead against a long judicial timeline (six years with a 10% decline, worth 67.2% of the balance in the same model).
The funding cost here is deliberately low. The 1.82% figure is an average that includes non-interest-bearing deposits and was measured before the Fed’s Sept. 16 increase. At the Fed’s 3.90% rate on reserves [16], the three-year hold values fall to about 76% (flat) and 70% (slipping) of the balance, and they fall further at a bank’s cost of equity. The model also leaves out legal fees, property taxes, insurance and the risk-weight cost. Each of these makes holding look better here than it probably is. On the other side, it gives holding no credit for guarantor recoveries, payments received while on nonaccrual or a cure, which the next section takes up.
When holding is the right call
Holding is a real strategy, not a failure of nerve. Adding a cure to the same kind of model, where the borrower recovers and repays the full balance within a year, holding and selling at net book value break even at a cure probability of about 21% for a one-year resolution with no further decline, about 45% for two years with a 5% decline and about 65% for a six-year judicial path with a 10% decline. Above those odds, holding wins. Against an actual offer of 78%, any real chance of a cure makes holding the better choice in the one- and two-year cases. Flat or rising values, a temporary problem, a guarantor with real capacity to pay, and a low realistic price all point the same way, and a bank that holds with a documented plan, current valuations and timely charge-offs is doing what the 2023 statement describes [2].
The opposite case is just as clear. If values are slipping, the timeline is long and a realistic price sits near or above the hold value, waiting mostly buys more quarters of a 1.91% noncurrent ratio and a 13.1% Texas ratio, plus a larger final loss. What a sale buys is certainty about the loss, a clean line on the next peer report and staff time back for the rest of the book. Whether that is worth the price is your board’s judgment, not something a spreadsheet can prove. The only real price for a particular loan comes from bids on it, and getting a price does not by itself commit a bank to sell. Either way, a well-documented choice is the one that holds up with examiners, auditors and your own directors.
Sources
- FDIC BankFind Suite API, Call Report data for June 30, 2026 (with June 30, 2023–2025 for the trend and June 30, 2019 and 2007 for reference), insured institutions with $500 million to $3 billion in assets (1,379 with capital data in 2026), retrieved Oct. 17, 2026. Percentiles, composite banks and scenarios are Amerinote calculations (Oct. 17, 2026). https://api.fdic.gov/banks/financials?filters=REPDTE%3A20260630%20AND%20ASSET%3A%5B500000%20TO%203000000%5D&fields=CERT,NAME,STALP,REPDTE,ASSET,LNLS,NCLNLS,NALNLS,NCLNLSR,ORE,EQ,INTAN,LNATRES,LNRESNCR,RBC1AAJ,RBCRWAJ,RBC,RBCT1,CBLRIND,ROA,NIMY,NTLNLSR,ELNATRY,EEFFR,INTEXPY,LNRECONS,LNREMULT,LNRENROT,LNRENROW&limit=10000&format=json. Field definitions: https://api.fdic.gov/banks/docs/risview_properties.yaml
- OCC, Federal Reserve, FDIC and NCUA, “Policy Statement on Prudent Commercial Real Estate Loan Accommodations and Workouts” (June 29, 2023), FIL-34-2023. https://www.fdic.gov/news/financial-institution-letters/2023/fil23034a.pdf
- 26 U.S.C. § 11(b) (21% rate), § 585(c) (large banks, reserves not deductible) and § 582(c) (bank loan sales not capital transactions). https://www.law.cornell.edu/uscode/text/26/11, https://www.law.cornell.edu/uscode/text/26/585 and https://www.law.cornell.edu/uscode/text/26/582
- FDIC, RMS Manual of Examination Policies, Section 1.1 (Uniform Financial Institutions Rating System). https://www.fdic.gov/resources/supervision-and-examinations/examination-policies-manual/section1-1.pdf
- OCC and FDIC, “Agencies Issue Final Rule to Prioritize Material Financial Risks” (Aug. 27, 2026), 91 FR 56004 (Sept. 1, 2026), effective Nov. 2, 2026. https://www.fdic.gov/news/press-releases/2026/agencies-issue-final-rule-prioritize-material-financial-risks and https://www.federalregister.gov/documents/2026/09/01/2026-17823/unsafe-or-unsound-practices-matters-requiring-attention
- FFIEC, “Uniform Financial Institutions Rating System,” proposal, 91 FR 29128 (May 19, 2026). https://www.federalregister.gov/documents/2026/05/19/2026-09944/uniform-financial-institutions-rating-system
- 12 CFR 363.1(a) and 363.2(a), annual independent audits. https://www.law.cornell.edu/cfr/text/12/363.1 and https://www.law.cornell.edu/cfr/text/12/363.2. FDIC, “Adjusting and Indexing Certain Regulatory Thresholds,” 90 FR 55789 (Dec. 4, 2025), effective Jan. 1, 2026. https://www.federalregister.gov/documents/2025/12/04/2025-21914/adjusting-and-indexing-certain-regulatory-thresholds
- 12 CFR 324.32 (risk weights) and 324.403 (10% well-capitalized total ratio). https://www.law.cornell.edu/cfr/text/12/324.32 and https://www.law.cornell.edu/cfr/text/12/324.403
- 12 CFR 324.12, Community bank leverage ratio framework. https://www.law.cornell.edu/cfr/text/12/324.12
- FDIC, Quarterly Banking Profile, Second Quarter 2026, statement (Aug. 25, 2026). https://www.fdic.gov/news/speeches/2026/fdic-quarterly-banking-profile-second-quarter-2026
- Dechert LLP and Wells Fargo Securities, PSA investor guide (June 2013). https://www.dechert.com/content/dam/dechert%20files/knowledge/onpoint/2013/6/AnInvestorsGuidetoThePoolingandServicingAgreement.pdf
- PayScale, “Average Special Assets Officer Salary” (updated Feb. 19, 2026). https://www.payscale.com/research/US/Job=Special_Assets_Officer/Salary
- BLS, ECEC news release (Sept. 9, 2026). https://www.bls.gov/news.release/ecec.nr0.htm
- Green Street, “Waiting for Price Clarity,” CPPI release (Oct. 6, 2026). https://www.greenstreet.com/waiting-for-price-clarity/
- Green Street, CPPI release with sector table (Sept. 4, 2026). https://info.greenstreet.com/hubfs/GSCPPI-20260904press.pdf
- Federal Reserve, FOMC statement and implementation note (Sept. 16, 2026). https://www.federalreserve.gov/newsevents/pressreleases/monetary20260916a.htm and https://www.federalreserve.gov/newsevents/pressreleases/monetary20260916a1.htm
Comments and questions are welcome · abby@amerinote.capital · (800) 609-9520
This brief is for informational purposes only and is not legal, tax, accounting, regulatory or investment advice. Figures are illustrative, based on the stated assumptions; each institution should consult its own advisors.